
Troubleshooting
When auto-mcs encounters an issue, it can record what happened in the application log, or an exception report. These files are useful for determining which part of the app failed, what it was doing, and when it happened.
Log directories
Section titled “Log directories”All log and error reporting is stored inside the app data directory. You can open this directory from the folder icon in app settings.
Logs/application | Runtime logs; initialization, activity, warnings, and errors |
Logs/errors | Non-fatal exception reports during processes like server creation or imports |
Logs/crashes | Fatal exception reports, including watchdog terminations from hangs |
Logs/telepath | Audit logs for Telepath authentication, sessions, and remote actions |
Diagnosing a problem
Section titled “Diagnosing a problem”If auto-mcs is still open, start by checking the most recent entries in the application log. The last line isn’t usually the cause of the problem. Look for the first relevant WARNING, ERROR, or traceback preceding the failed action.
If an AME appears, locate the corresponding file in Logs/errors or Logs/crashes and check the traceback.
When reporting an issue, include the AME report itself. If one does not exist, include the version of auto-mcs, operating system, what you did before the error, and the relevant application log.
Debugging
Section titled “Debugging”Use --debug to enable verbose logging:
./auto-mcs --debugOn Linux, or when passing STDOUT on macOS, debug logging will appear in the TTY it was launched from. On Windows, the compiled app can attach to an existing console or open one if necessary:
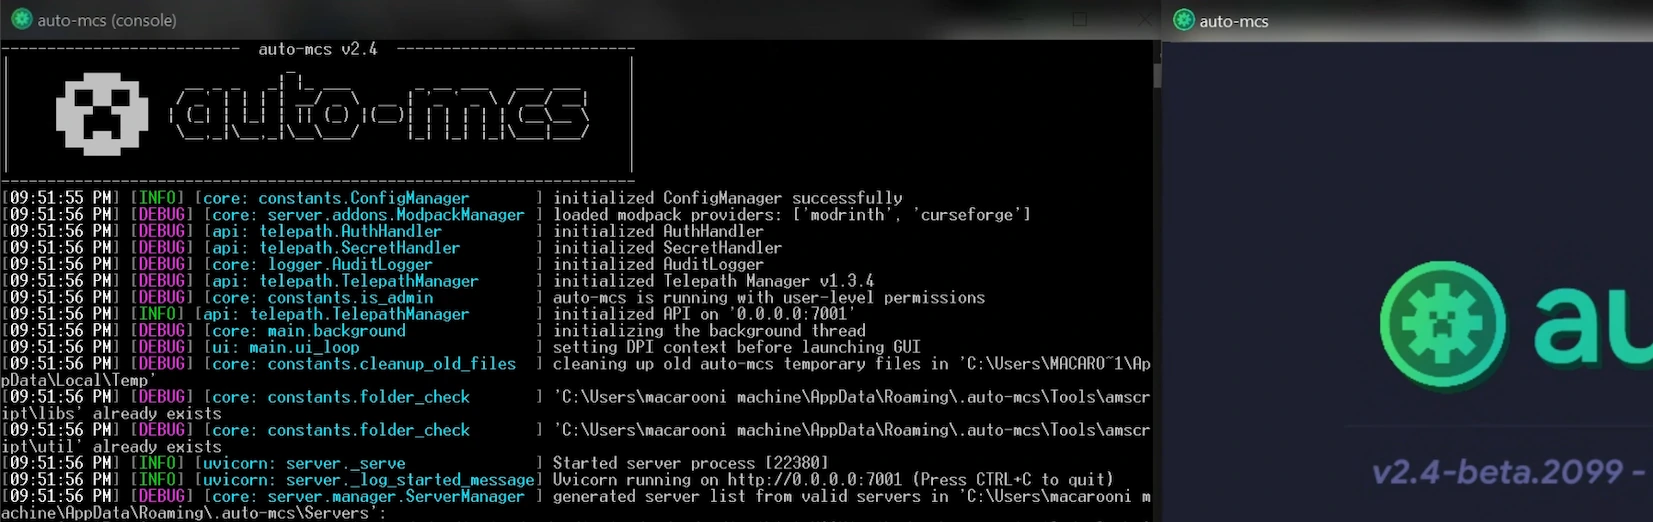
Debug mode is useful when diagnosing startup problems, unexpected behavior, or errors that occur before the UI has fully initialized. If auto-mcs closes unexpectedly, it will return an exit code that may help identify the cause.
If auto-mcs encounters a crash, it will create an exception report, detailed below.
Application logs
Section titled “Application logs”Each time you start auto-mcs, the logger creates a unique session, and flushes in Logs/application, named auto-mcs_<timestamp>.log. The timestamp identifies when the session started. Application logs are buffered in memory until they are flushed to disk once every 5 minutes, and on close.
At the beginning of a log is a short header containing the launch time, process ID (pid), and a short launch identifier (id). These are used to distinguish one run of the app from another.
The app records information about its initialization, such as the version, launch flags, permissions, current language, Telepath status, processor, and memory usage.
A healthy lifecycle looks like this
# 2:45:08 PM 10/17/2026 (pid 19404) id=bb4d37
┏━━━━━━━━━━━━━━━━━━━━━━━━━  auto-mcs v2.4  ━━━━━━━━━━━━━━━━━━━━━━━━━┓┃                              _                                    ┃┃      ▄▄████▄▄     __ _ _   _| |_ ___       _ __ ___   ___ ___     ┃┃     ▄█  ██  █▄   / _` | | | | __/ _ \  __ | '_ ` _ \ / __/ __|    ┃┃     ███▀  ▀███  | (_| | |_| | || (_) |(__)| | | | | | (__\__ \    ┃┃     ▀██ ▄▄ ██▀   \__,_|\__,_|\__\___/     |_| |_| |_|\___|___/    ┃┃      ▀▀████▀▀                                                     ┃┃                                                                   ┃┗━━━━━━━━━━━━━━━━━━━━━━━━━━━━━━━━━━━━━━━━━━━━━━━━━━━━━━━━━━━━━━━━━━━┛[02:45:08 PM] [INFO] [core: constants.ConfigManager       ] initialized ConfigManager successfully[02:45:09 PM] [INFO] [core: server.manager.ServerManager  ] initialized Server Manager[02:45:09 PM] [INFO] [ui: main.ui_loop] initializing auto-mcs with the following properties:   >  Version:           v2.4-beta.2099 - macOS 26.6.2 (b-25G83, ARM 64-bit)   >  Launch flags:      None   >  Online:            False   >  Permissions:       User-level   >  UI Language:       English (en)   >  Headless:          False   >  Telepath server:   Active   >  Processor info:    12 (12) C/T @ 4.06 GHz (64-bit)   >  Used memory:       8.28 / 18 GB[02:45:09 PM] [INFO] [ui: desktop.utility.run_application ] initializing graphical UI (Kivy)[02:45:11 PM] [INFO] [core: main.foreground               ] UI has exited gracefully
Reading a log entry
Section titled “Reading a log entry”Log entries use the following format:
[HH:MM:SS TT] [level] [stack: caller] message[09:35:27 PM] [INFO] [core: constants.ConfigManager] initialized ConfigManager successfullyHH:MM:SS TT | Time the event occurred, in this format |
level | Severity or type of the event |
stack | Application subsystem logging category |
caller | Python object or function where the event originated |
message | Description of event details |
Messages like the above boot log, and exceptions, have several indented lines showing the system information, or the traceback, respectively. Additional lines begin with > and belong to the preceding line’s message, rather than indicating a separate event.
Log levels
Section titled “Log levels”DEBUG | Extremely detailed reporting, useful when reproducing a problem (hidden by default) |
INFO | Normal operation, such as object initialization or a completed action |
WARNING | Something unexpected that doesn’t impede functionality |
ERROR | Unexpected failure that impedes functionality, and continues runtime |
CRITICAL | Serious error that originates from core dependencies |
FATAL | Severe failure that terminates runtime |
Viewing live
Section titled “Viewing live”Running auto-mcs from a terminal on macOS or Linux will block and display the live application log in the TTY. On Windows, debug mode will launch a separate window allowing you to view this as well. See Debugging below for more details.
Since the STDOUT is obscured in headless mode, you can view the application log with a command instead.
Viewing on disk
Section titled “Viewing on disk”Application logs are stored in:
| Windows | %appdata%\.auto-mcs\Logs\application |
| macOS | ~/Library/Application Support/auto-mcs/Logs/application |
| Linux | ~/.auto-mcs/Logs/application |
The log manager retains up to 5 application run logs. Due to buffering, the newest file may not yet contain a fresh error, unlike the live output. For an unexpected shutdown, a separately generated exception report can be more useful for determining the immediate cause.
Exception reports
Section titled “Exception reports”In addition to run logs, auto-mcs generates AME (Auto-MCS Exception) reports when the error reporter is invoked. Unlike the application log, which records activity across an entire session, an AME report is an organized snapshot of a particular failure.
| Location | Type | Cause |
|---|---|---|
Logs/errors/ame-error_<timestamp>.log | Process error | An action displays an error but continues runtime |
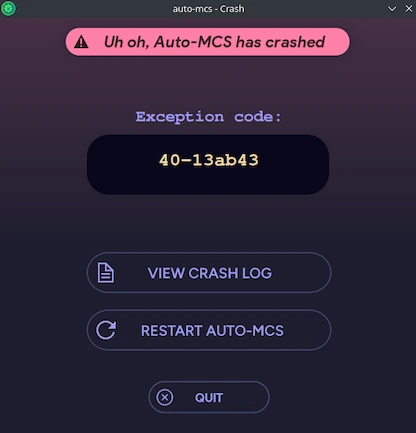
Logs/crashes/ame-fatal_<timestamp>.log | Fatal error | The app crashes, its main UI terminates unexpectedly, or a monitored thread hangs during shutdown |
The filename includes the time and date when the report was generated. auto-mcs keeps up to 25 exception reports in each of these folders. For fatal exceptions, a crash window will be displayed:
Reading an AME
Section titled “Reading an AME”An AME report will include the following sections:
| Auto-MCS Exception | The AME identifier printed at the top of the report |
| General Info | Minified system context information, and general app state |
| Time of AME | When the exception was recorded |
| Application path at time of AME | The navigation context inside the app |
| Last interaction at time of AME | The last recorded UI interaction, when available |
| AME traceback | The Python exception, where it occurred, and the full traceback |
| Logging since last interaction | Application log since the last UI action |
An AME report is structured like this
==============================================================================================================================||                                             Auto-MCS Exception:    f9-2debe1                                             ||||                                   "Please wait while I pretend to know what I'm doing"                                   ||==============================================================================================================================

    General Info:
        Severity:          Fatal        ...


    Time of AME:
        6:45:48 PM  10/14/2026


    Application path at time of AME:
        Server Manager > amscript @ 6:45:46 PM


    Last interaction at time of AME:
        IconButton @ 6:45:48 PM


    AME traceback:
        Exception Summary:
            KeyError: 'performance'            (File "amscript.py", line 1669, in __init__)
        Traceback (most recent call last):          ...

    Logging since last interaction:
[06:45:48 PM] [DEBUG] [ui: desktop.utility.navigation ] interaction: 'IconButton' ...Another type of crash is when the background thread hangs. The process will be terminated after 30 seconds of inactivity after a requested shutdown. For a fatal hang, the report will also contain Failure type: Thread hang, active threads statistics, and stack traces showing what those threads were doing when the process stopped responding.
Telepath logs
Section titled “Telepath logs”The Logs/telepath directory contains session-audit_<date>.log files. These are separate from the application run logs and are intended for reviewing remote sessions and operations. Entries have their own INFO, AUTH, WARN, and HIGH classifications, which are audit categories, and are not the same as the app logger’s severity levels.
Learn more about Telepath audit logs
Exit codes
Section titled “Exit codes”When auto-mcs closes, it returns an exit code to the operating system indicating how the process terminated. This is especially useful when launching auto-mcs from a terminal, script, or automated environment.
The following codes are defined by the launcher and its bootstrapping process:
0 | Normal termination, including closing the app or handing execution to a restart/update process |
-1 | A server specified with --launch could not be found |
2 | Invalid launch arguments, such as an unrecognized flag or a missing required argument value |
10 | Another instance of auto-mcs is already running |
20 | Fatal exception, or could not terminate properly following a handled crash |
1 | An unhandled fatal exception or general runtime failure that isn’t caught by the handler |
When launching auto-mcs from a terminal, you can retrieve the exit code after the process terminates:
Windows (PowerShell)
.\auto-mcs.exe --debug$LASTEXITCODELinux/macOS
./auto-mcs --debugecho $?If auto-mcs closes unexpectedly, check the application run logs or exception reports for more information.